AT&T
Field Technician Tool
Crafted the right way.
As lead user researcher and co-strategist, I drove user understanding, prioritized features, and evaluated designs. I ensured rigorous research, efficient testing, and user advocacy in decision-making. This resulted in significant efficiencies and cost savings, along with our highest user-ranked internal software tool.
Jump to
Impact
$3 billion
6 year savings
$350M saved in first year
Reduced job times by 25 minutes
Reduced agent calls by 150k/month
Reduced support dispatches 25%
Increased usability score by 40 points
I was awarded the “Innovation Pathfinder” for my work on Atlas
“It’s the largest cost savings win in the company’s history”
Research
42 | Observations & interviews
54 | Moderated testing
221 | Unmoderated testing
747 | Survey responses
“Winter’s work on the tech experience was groundbreaking and set the stage for delivering a huge win for AT&T Technology Operations. ”
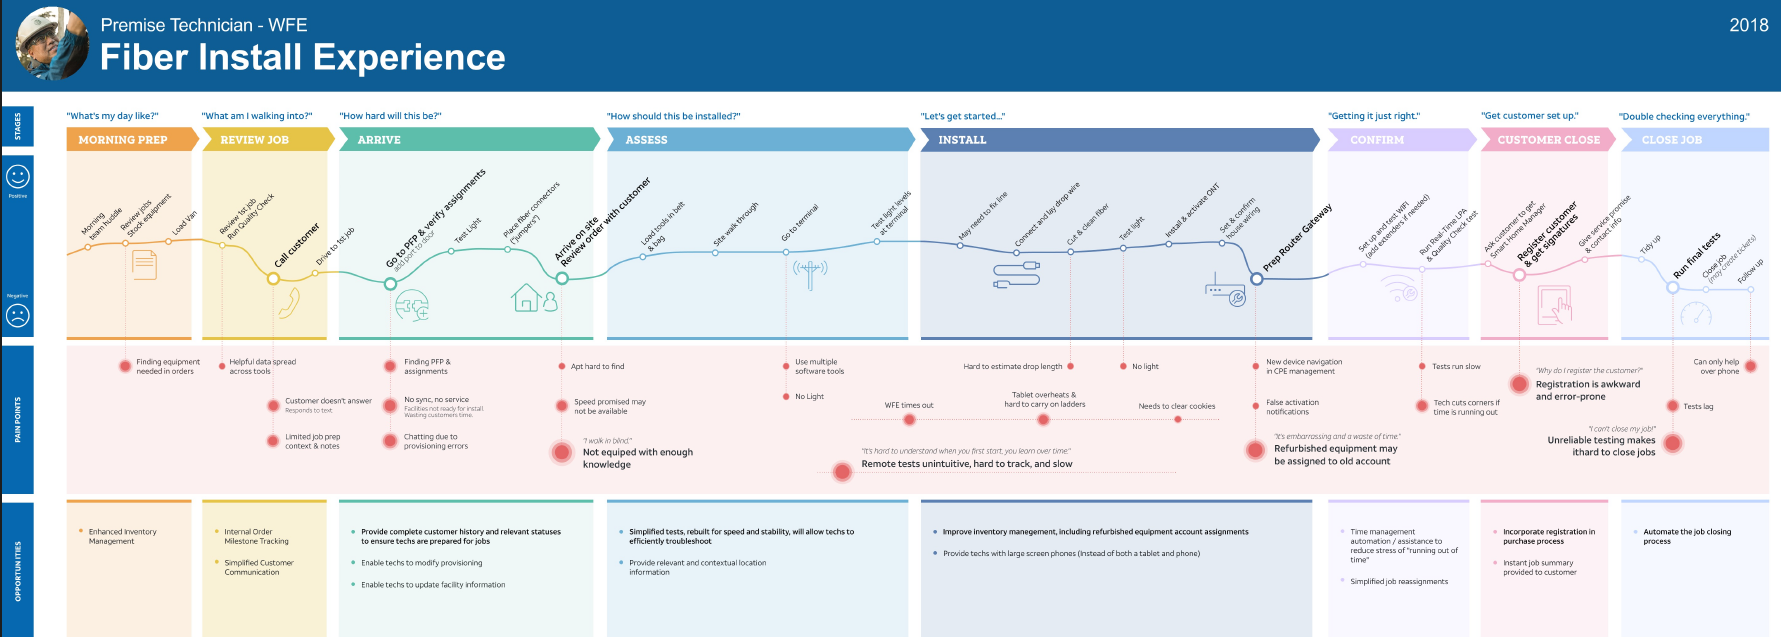
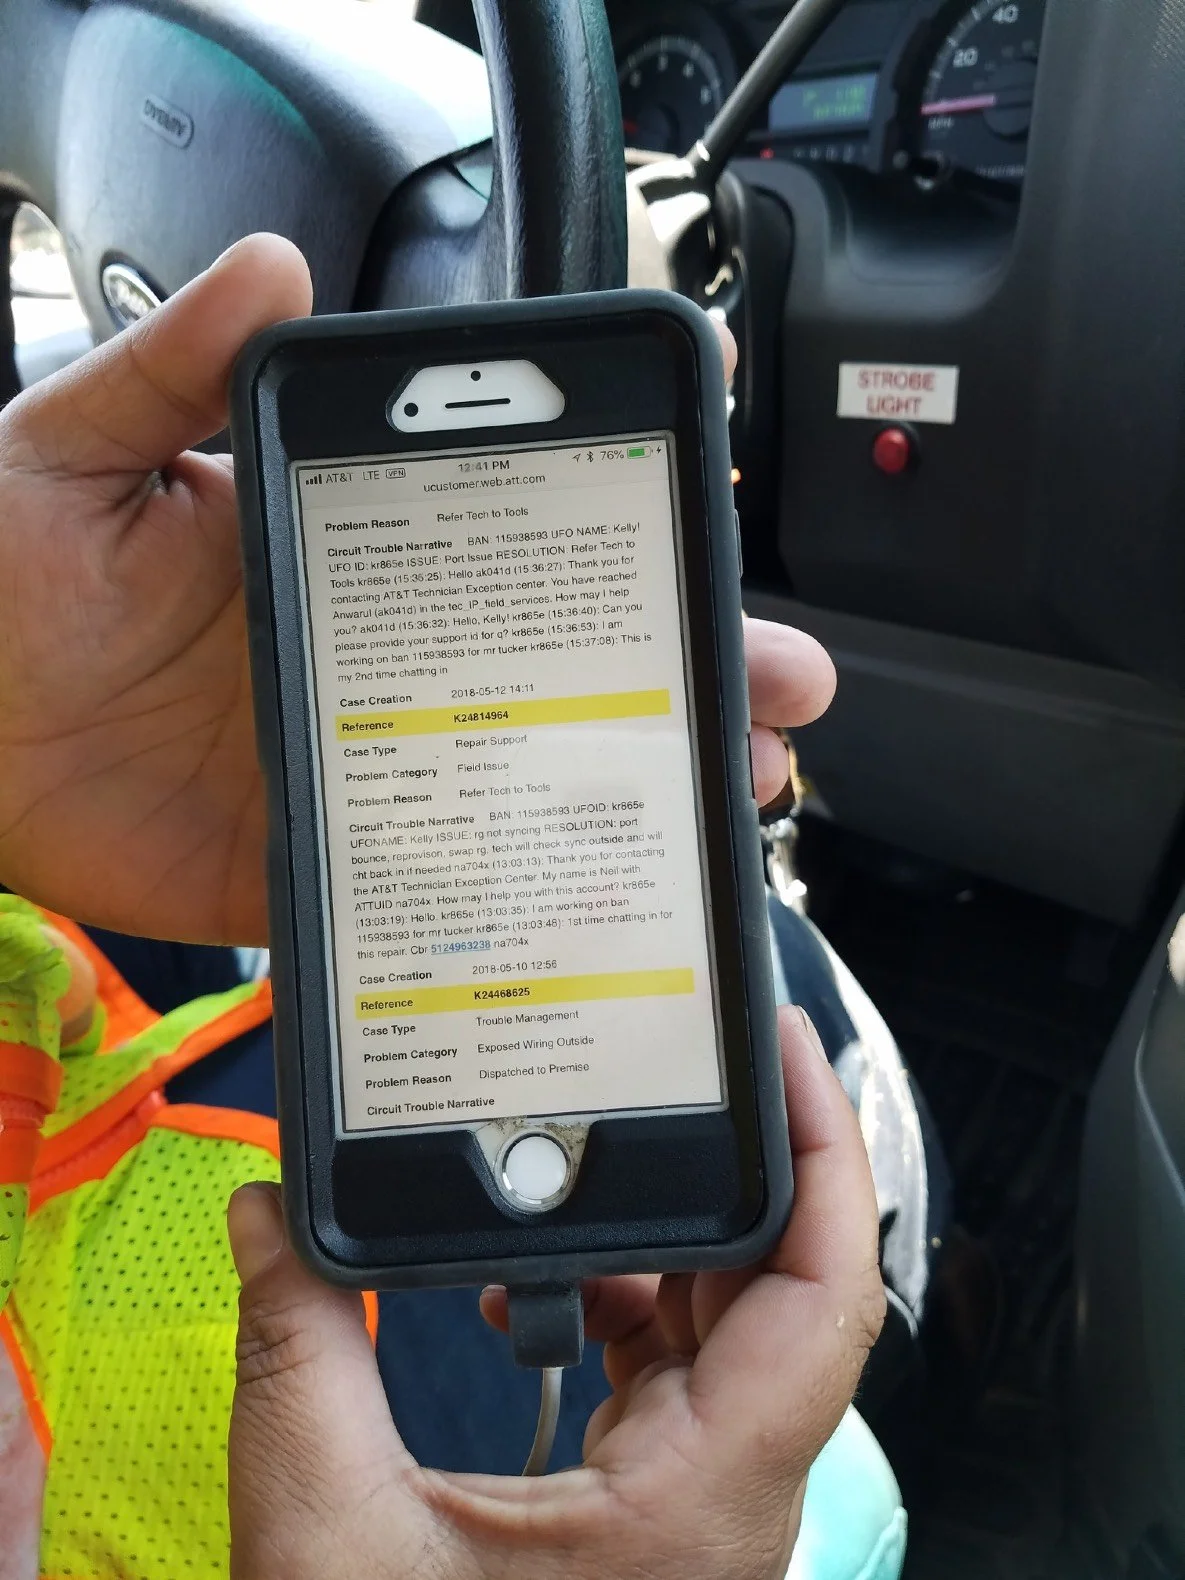
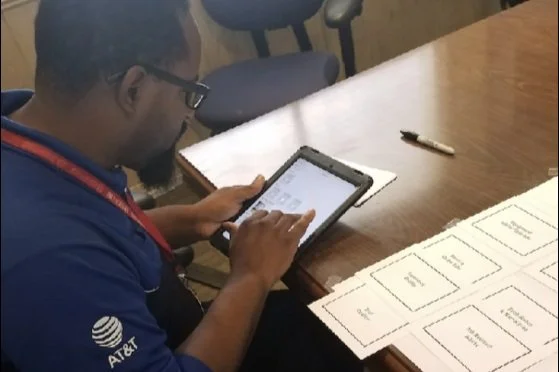
We started with true ethnography.
DISCOVER
After stakeholder reviews, I determined we needed to start fresh to grasp the realities of field technicians physical and digital processes.
I led the team by creating field research guidelines and coordinating rides with technician managers.
Through analysis, I identified key themes, tasks, and facilitated journey mapping sessions. We discovered unique friction filled interactions and efficiency improvement opportunities to drive our design decisions.
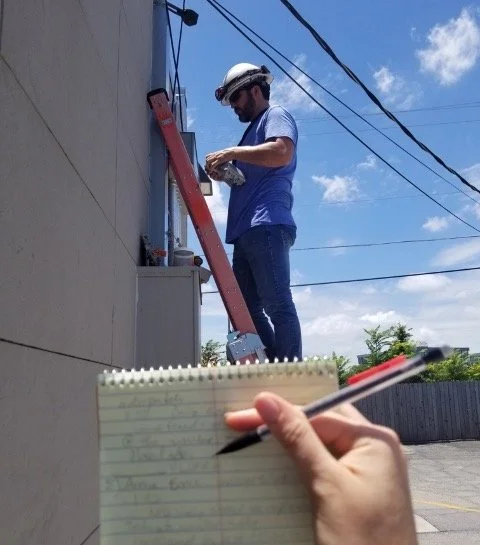
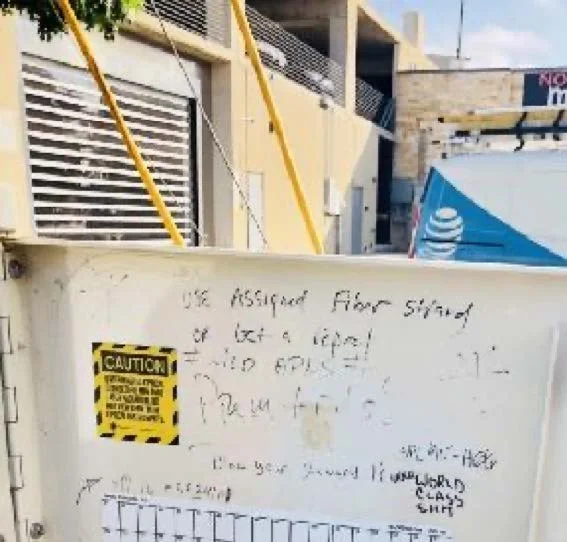
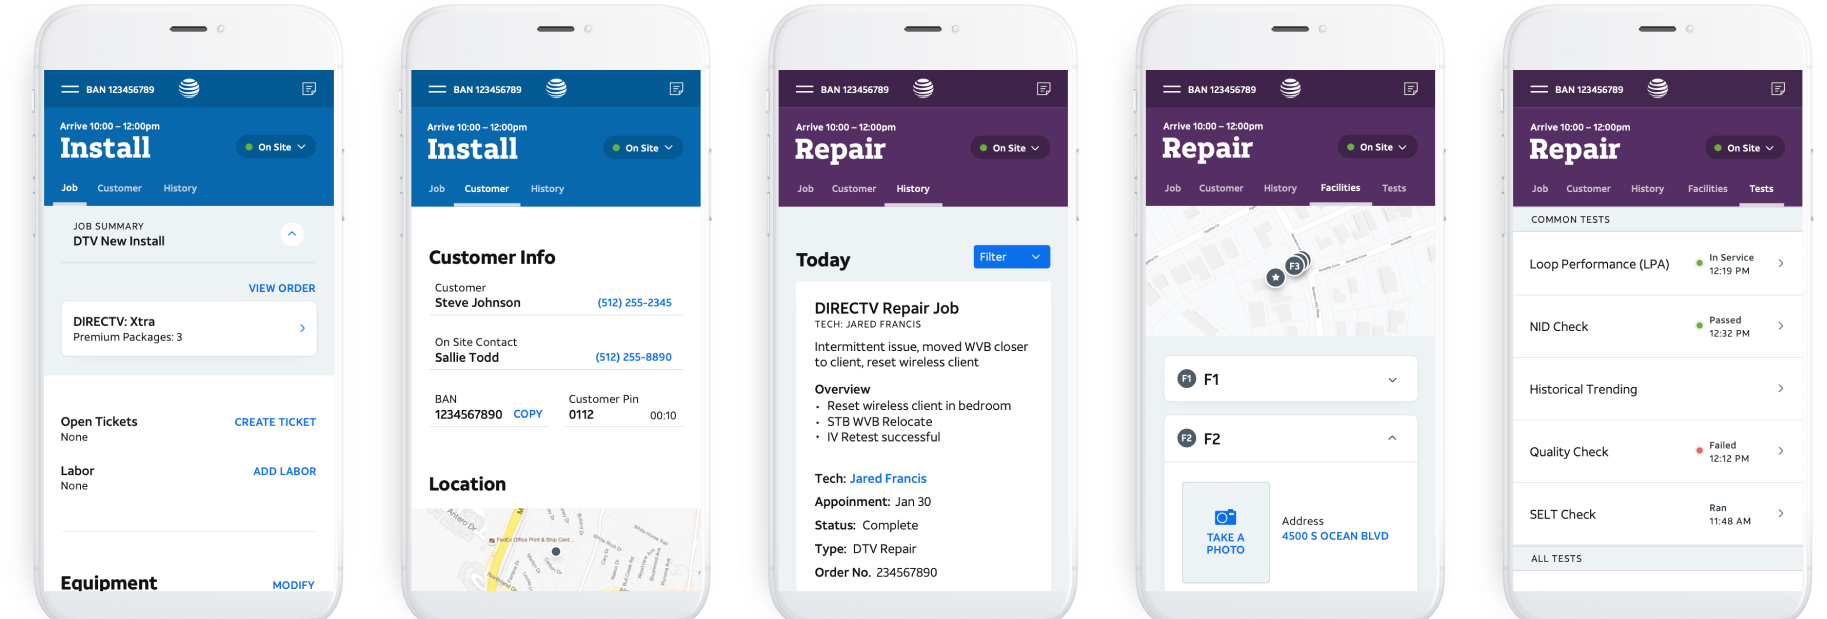
Example | Ethnographic insights
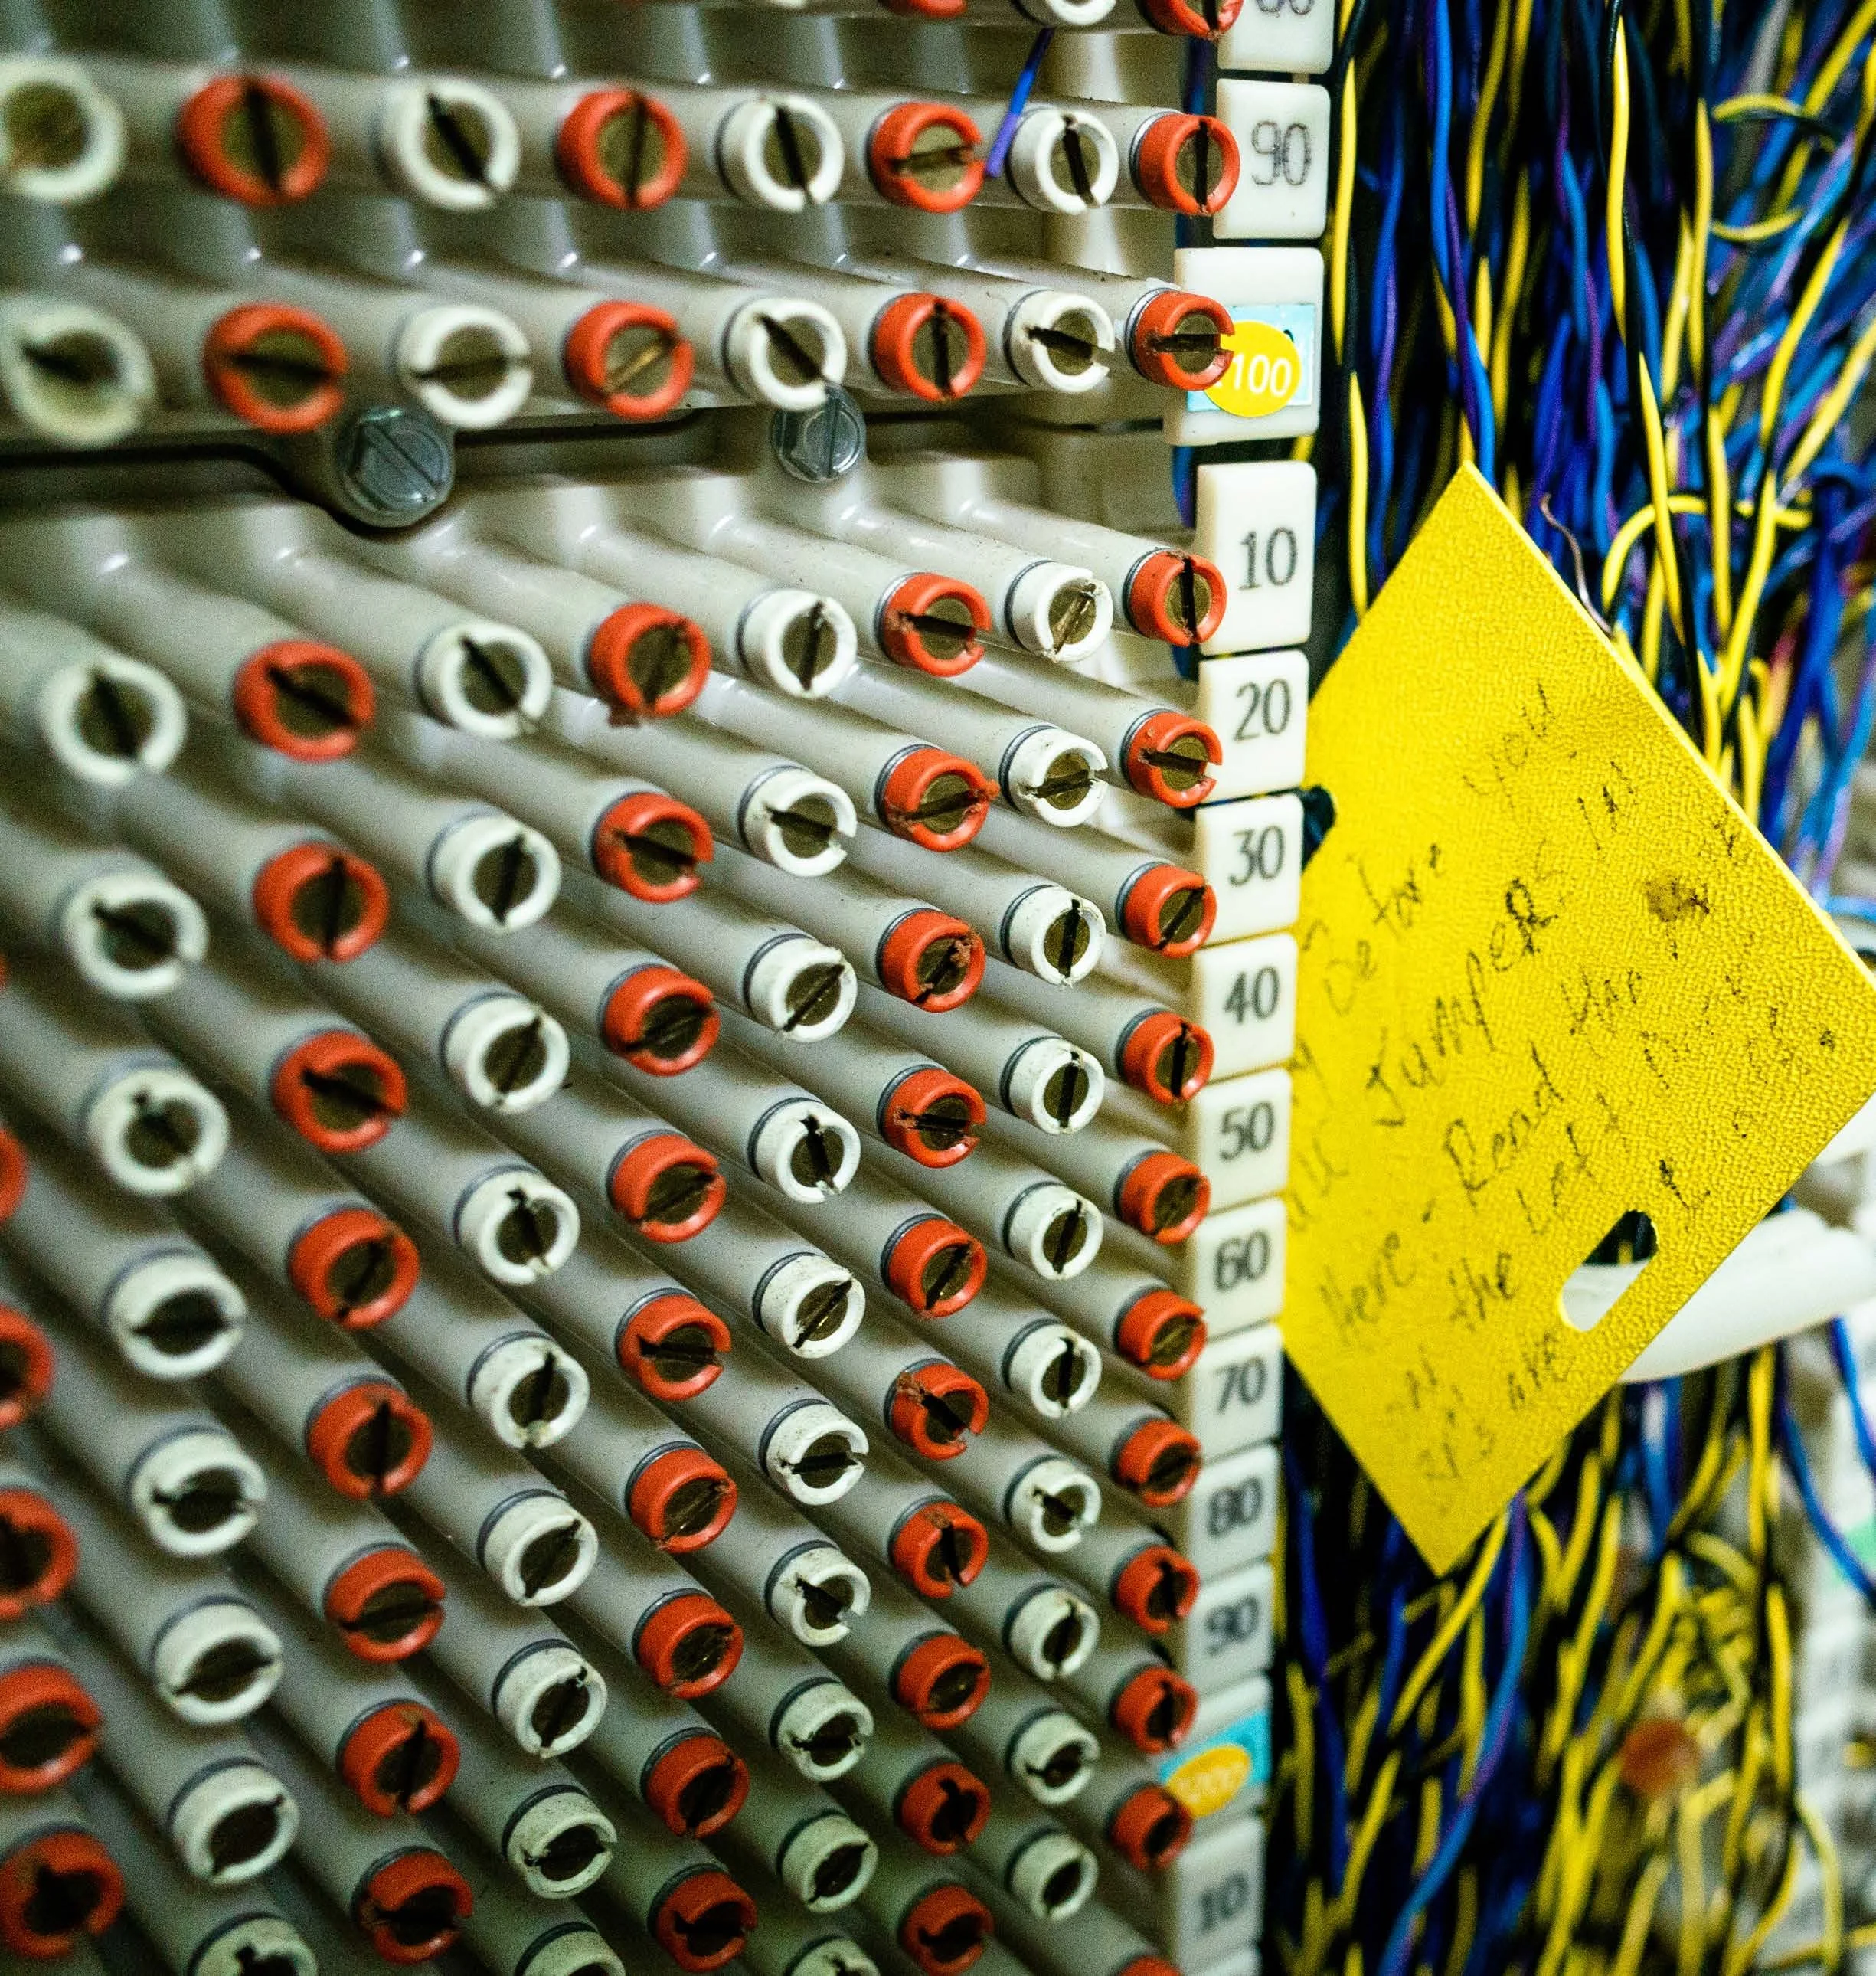
Facility information
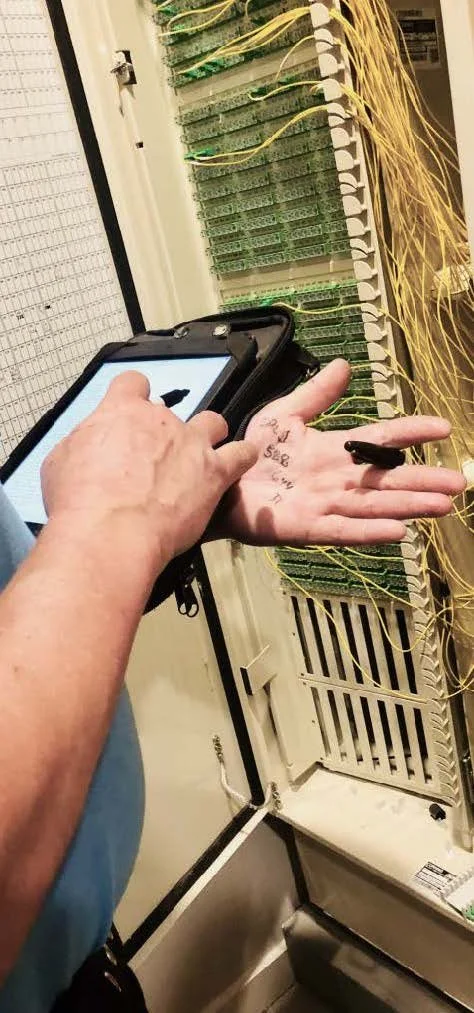
I observed
Techs graffiti facility boxes… to warn each other.
Most crossboxes had “not safe for work” drawings and text. Once we knew their shorthand lingo, I realized techs were warning each other about issues such as defective hardware, mislabeled data, dangerous creatures (e.g. snakes and spiders) and hard to find locations.
No tech mentioned this in any interviews or surveys.
This resulted in
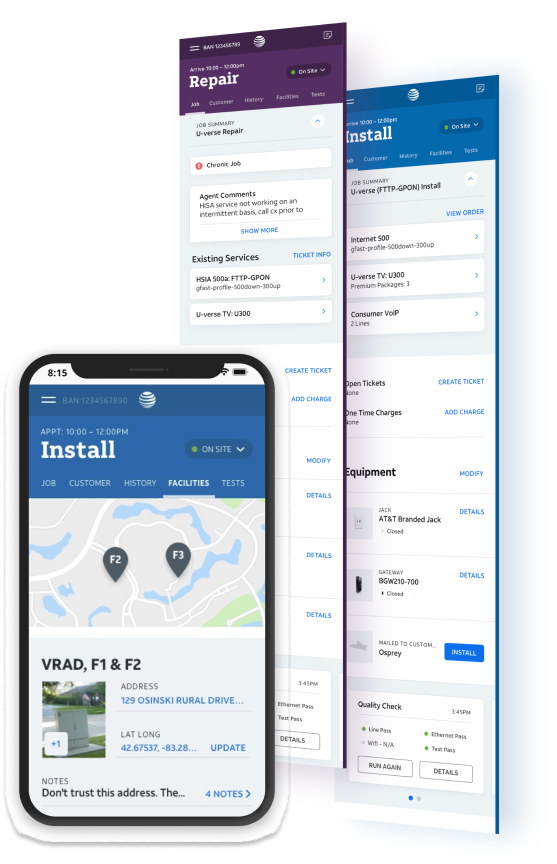
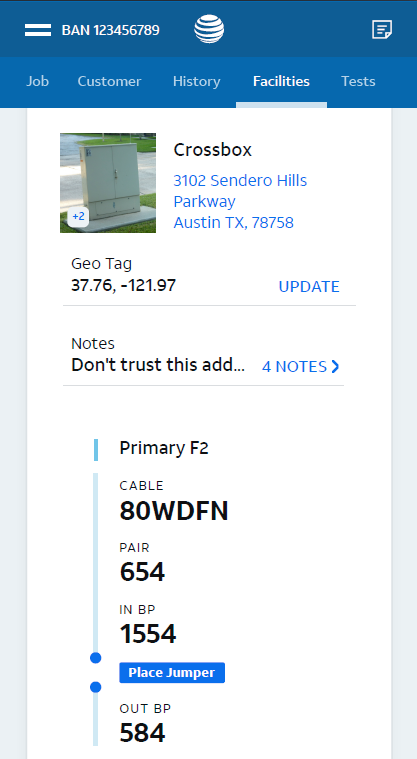
An editable facilities tab.
This section allowed technicians to easily find needed information but also geotag locations, add notes, add images, flag issues, and more. Beta feedback was extremely positive from techs.
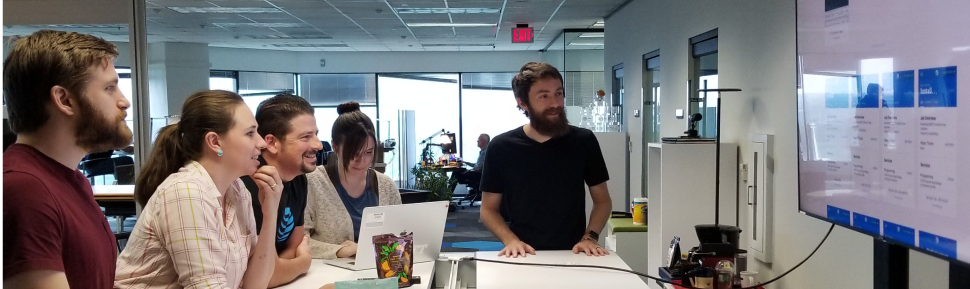
We did rapid iterative testing and design.
DESIGN
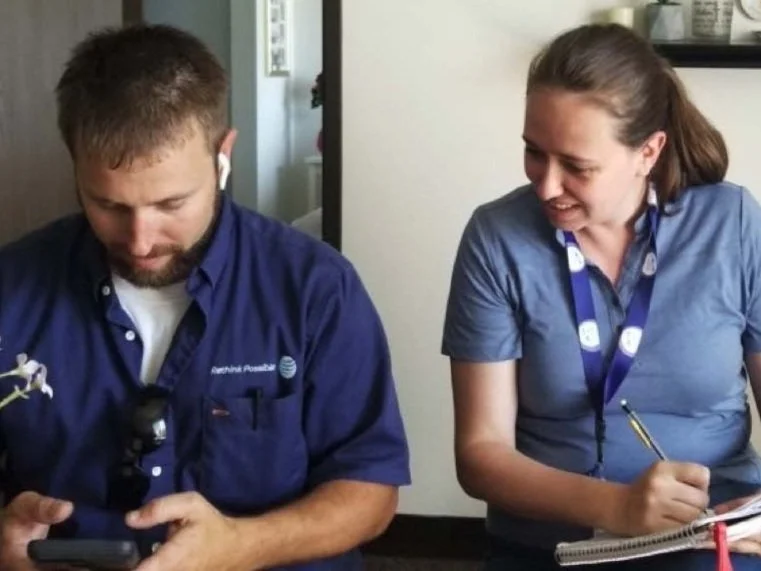
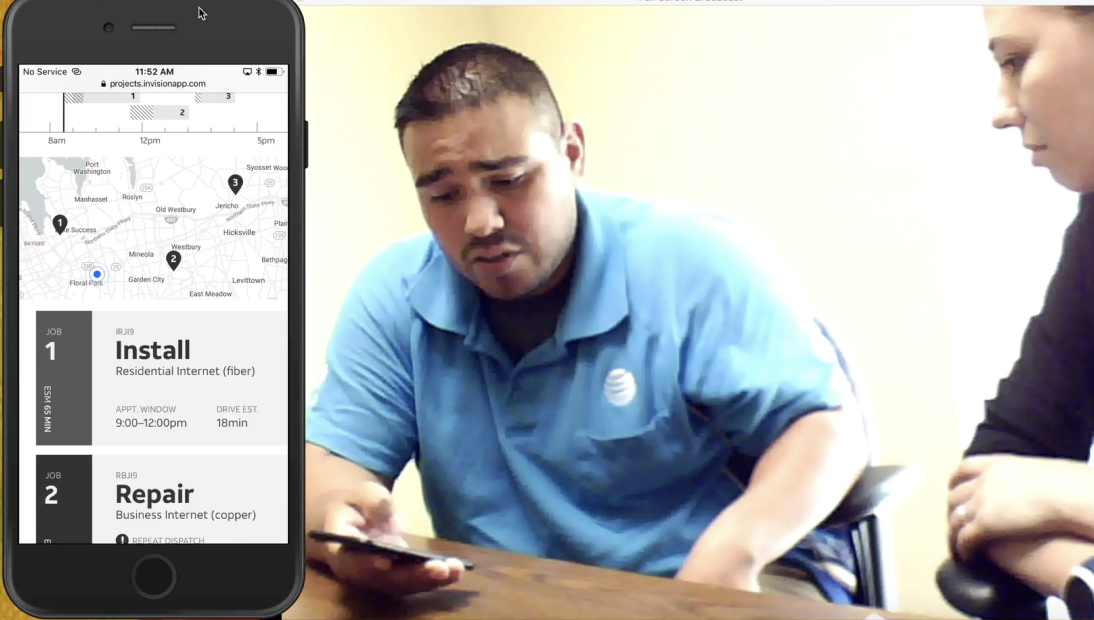
The design team took time to explore and iterate through design reviews. I pre-planned in-person moderated rapid iterative testing with different technicians for every session.
I leveraged various methods to answer our design and development team’s questions which included card sorting, concept testing, participatory design activities, usability testing, and more.
Concept testing and mental model exercises
Low-fidelity prototype testing
High-fidelity prototype testing
moderated 54 | unmoderated 221
Prototype Testing
Card sort activity
Design and development reviews
Example | Prototype testing insights
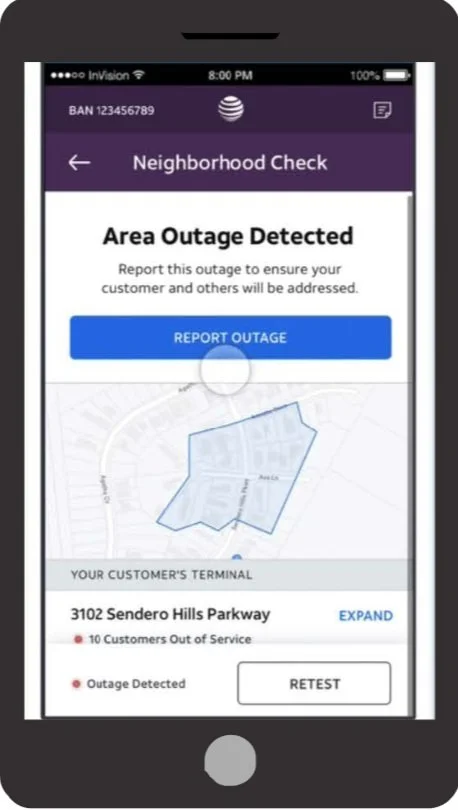
Area outages
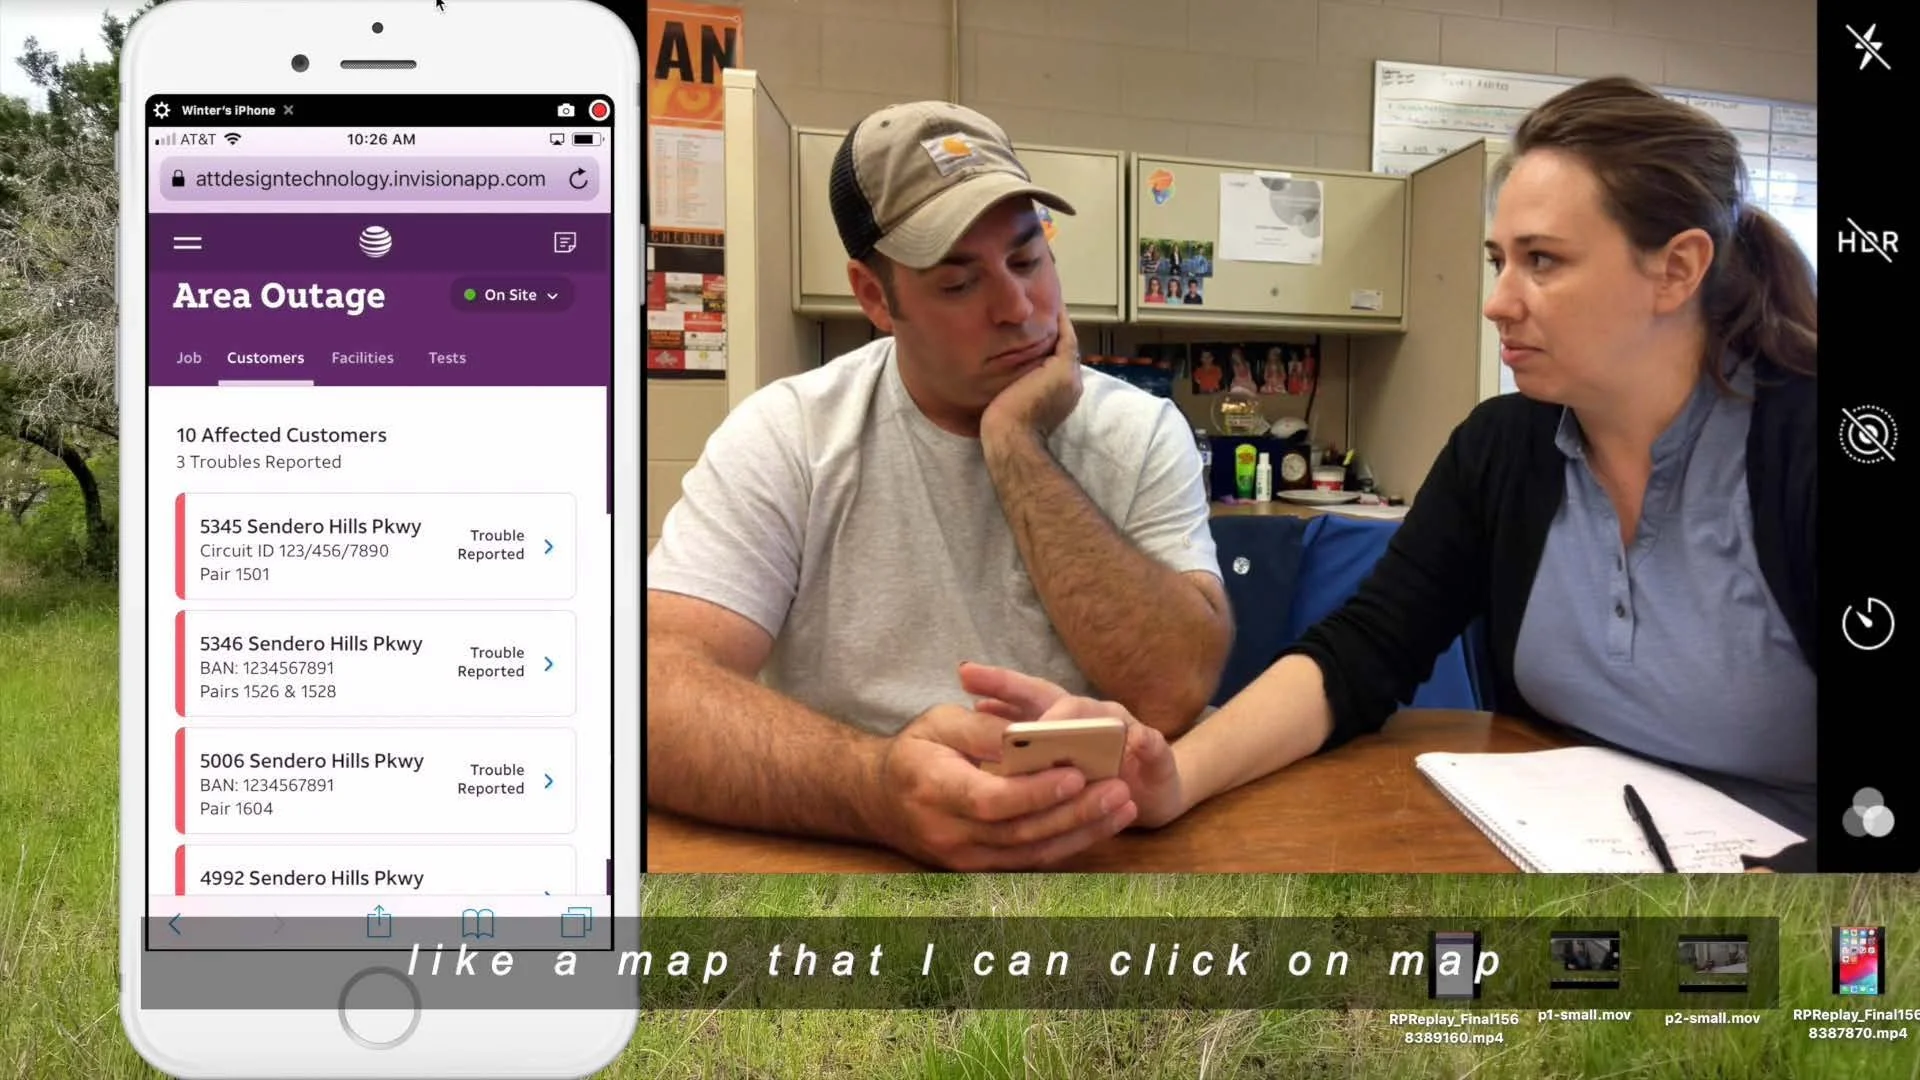
Testing showed
Our design required a lot of mental work.
After discovery we got too confident too soon and jumped to high-fidelity prototype testing.
However during testing, I realized that we provided the correct data the tech’s needed to triage area service issues, they were having to map out the problem in their heads.

“Oh my god, if you could get me that I would crap a kitten!” - Tech feedback
We needed to go back and iterate.
I had to convince design leadership and the Product Manager we needed to
add a new feature to the backlog
change the design and development timeline
design and test lo-fi mockups to test
then do unmoderated prototype testing
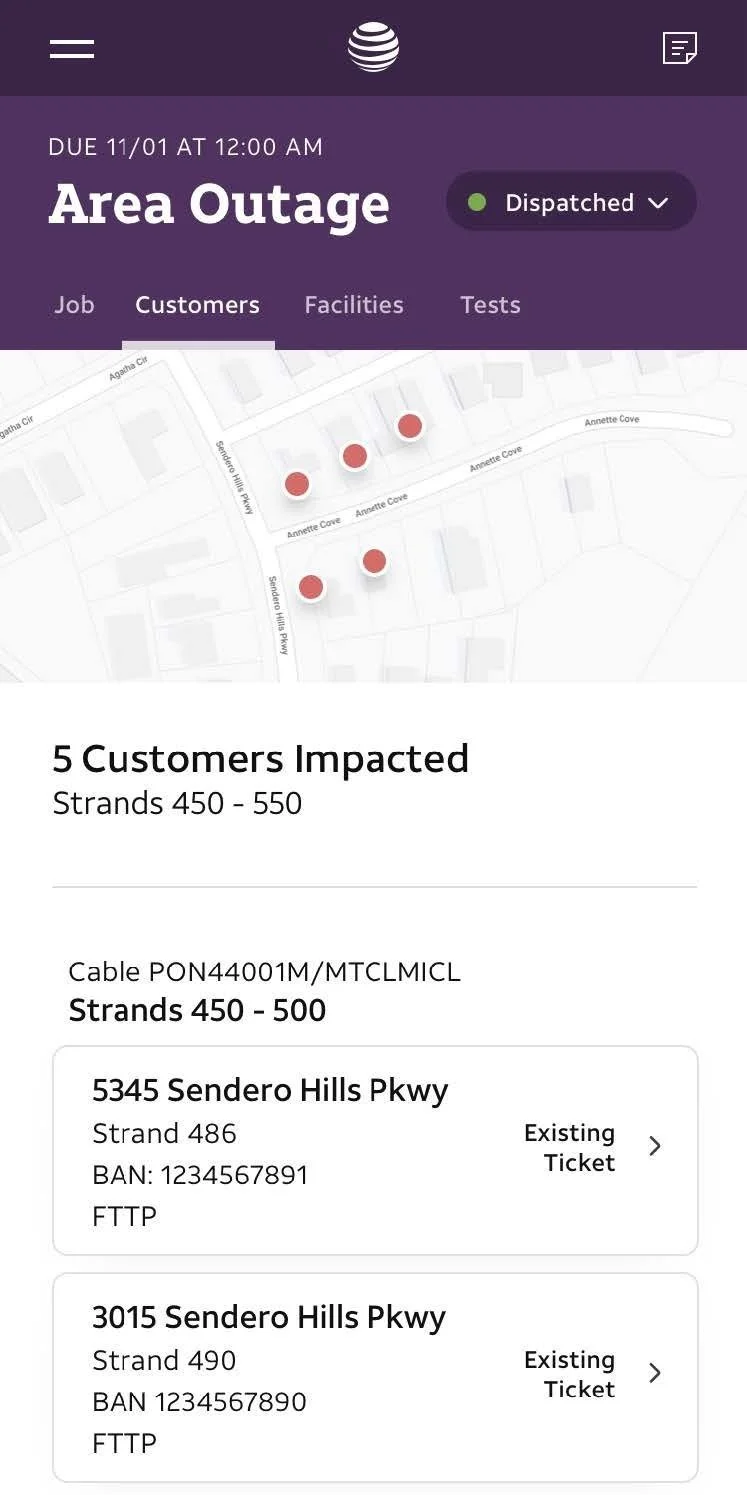
This resulted in
Solution that reduced time on task & mental load.
We created a map that helps tech diagnose and isolate the issue in less time.
Technicians use the map to track their diagnosis process by knowing which areas are still having issues and how the facilities are connected to those homes.
We tracked and observed.
DELIVER
I defined and helped create
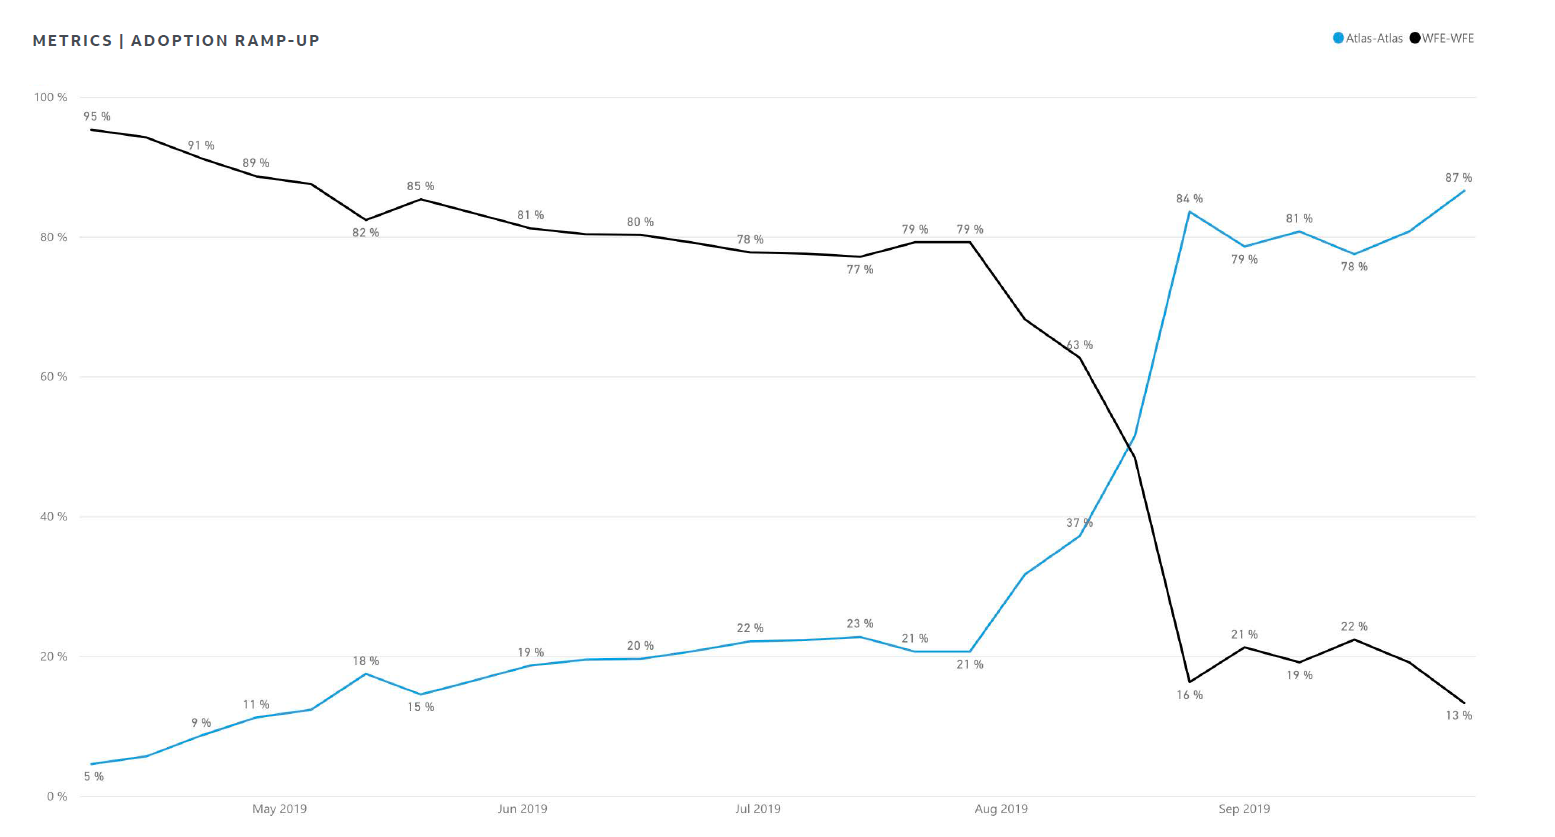
behavioral analytics and metric standards in preparation for the tools launch to ensure all partners could track and evaluate impact.
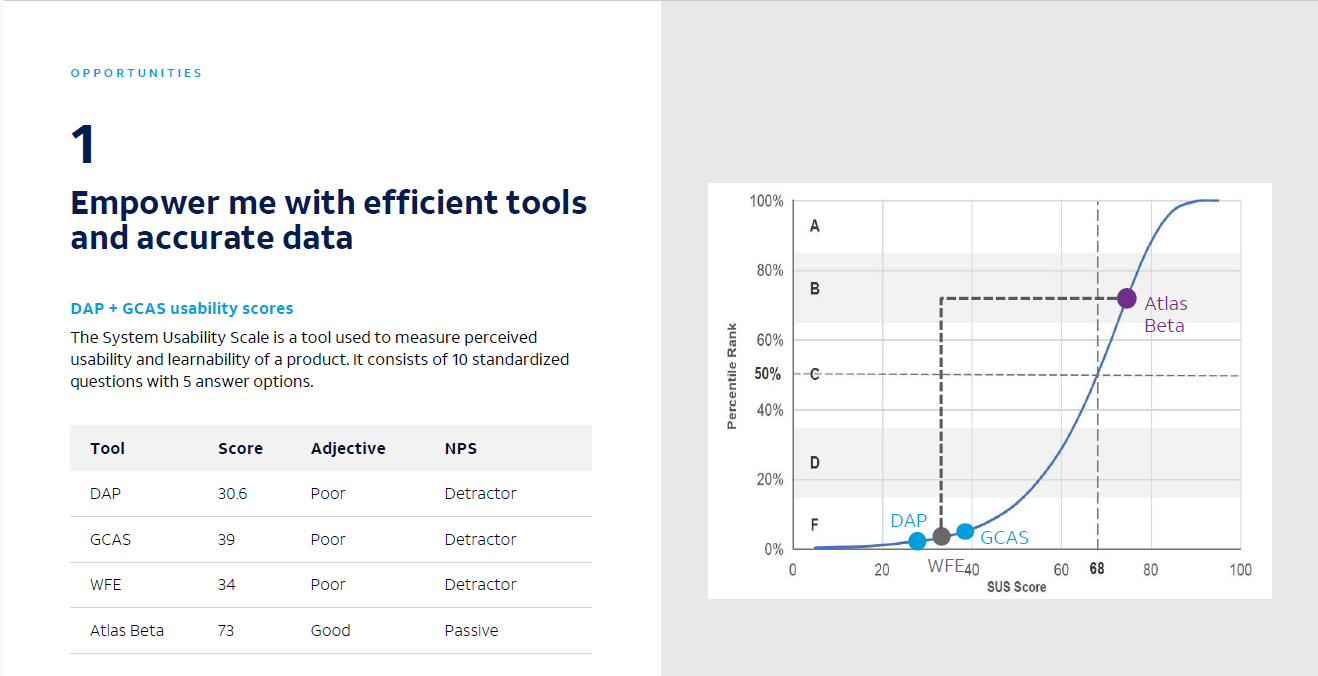
benchmarking using the system usability score (SUS) and defined guidelines to gather SUS scores from a statically significant sample of users on a quarterly basis.
a field observation process for researchers and designers to do quarterly focusing on newly launched or updated features. This was used to help prioritize planned features and design changes.
300 - 500 techs surveyed quarterly using System Usability Scale
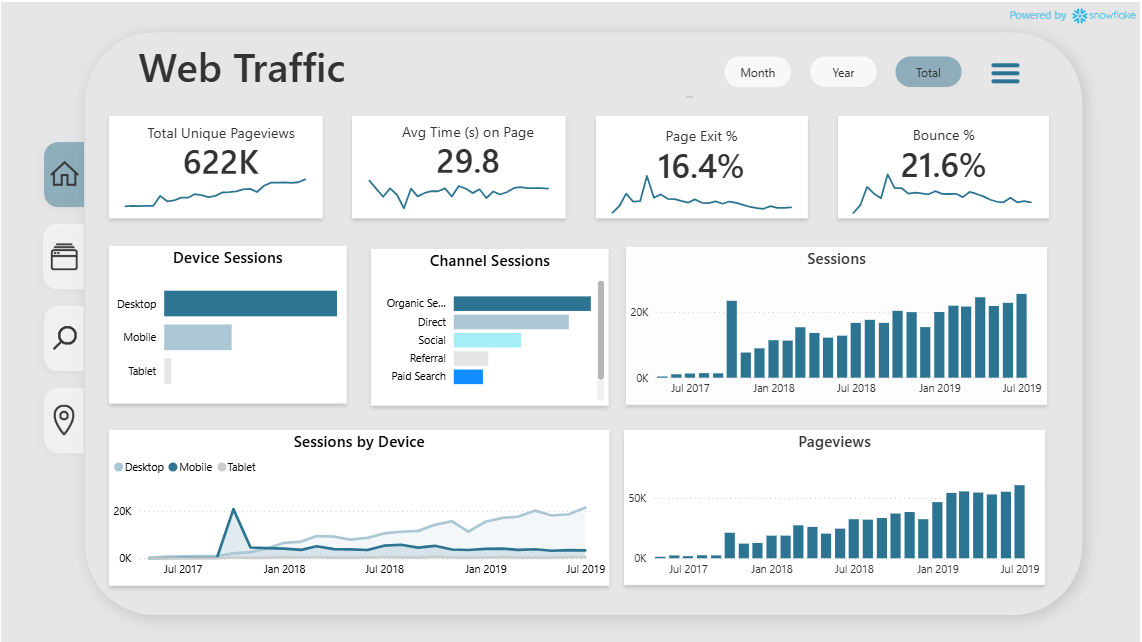
Created a usage analytics Power BI dashboard with data scientist